Unlock the Power of Your Data With DEFTeam
Empower your business with data-driven insights. Our expert Power B I consultants provide comprehensive services to help you harness the full potential of your data.
Our Power B I Services
We offer a wide range of Power B I services to meet your specific needs:
Data Modeling
Create robust and efficient data models that form the foundation of your Power B I reports and dashboards.
Data Cleaning and Transformation
Ensure data accuracy and consistency through thorough cleaning and transformation processes.
Data Visualization
Design visually stunning and interactive dashboards to communicate complex data stories effectively.
Data Analysis Expressions
Leverage the power of DAX to create dynamic calculations and calculations that drive business decisions.
Power B I Administration
Optimize your Power B I environment for performance, security, and scalability.
Data Analysis and Consulting
Gain valuable insights through in-depth data analysis and consulting services.
Data Integration and ETL
Seamlessly integrate data from various sources into your Power B I environment.
Power B I Embedded
Embed interactive Power B I reports and dashboards directly into your web applications.
Power B I Training
Our comprehensive Power B I training programs empower you and your team to leverage the full potential of the tool. Our training courses cover a wide range of topics, including:
- Power B I Fundamentals
- Data Modeling and DAX
- Data Visualization and Report Creation
- Power B I Administration and Security

Power B I Custom Visuals
Enhance your Power B I reports with custom visuals tailored to your specific needs. Our team of skilled developers can create custom visuals to visualize your data in unique and innovative ways.
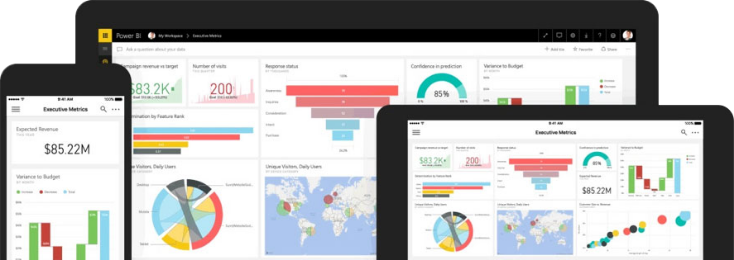
Power B I Demo Showcase
Explore our Power B I demo showcase to see firsthand the capabilities of Power B I. Our demos highlight real-world use cases and showcase the power of data visualization.
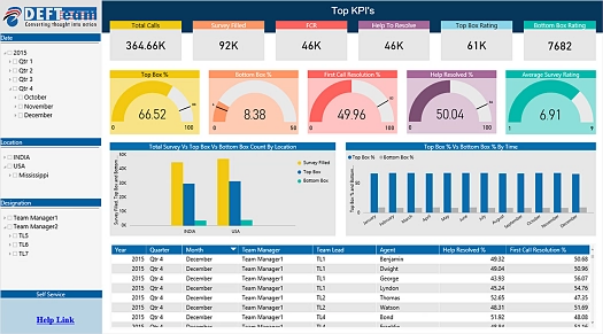
Analytical Solution for Call Center Analytics Based on Various K P I s Across Different Categories
TOP K P I s: This dashboard provides a comprehensive view of call center performance for top management. To further investigate details, end users can drill-down in other tabs.
Availability: This dashboard contains all the important K P I s related to availability along with trends. End users can drill-down into more granular details using Date, Location and Designation filters.
Efficiency: This dashboard helps the end user to assess the efficiency of a call center.
Availability: This dashboard contains all the important KPI related to Availability along with trends. End users can drill-down to into more granular details using Date, Location and Designation filters.
Efficiency: This dashboard helps the end user to assess the efficiency of a call center.
Time Distribution Analysis: This Dashboard includes survival analysis charts which assist in determining how long customers are willing to wait in the queue.
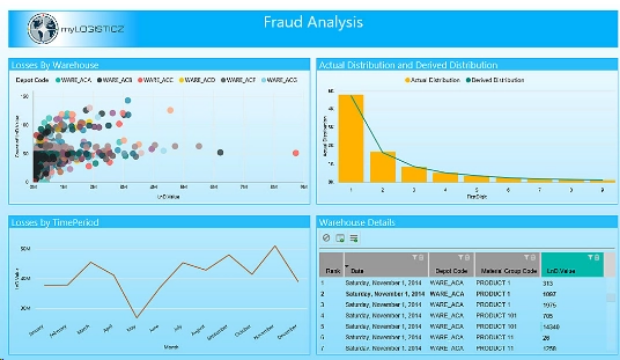
myLOGISTICZ - Supply Chain Management (SCM) Analytics
myLOGISTICZ is a Supply Chain Management Analytics & IoT driven technology agnostic solution, which uses powerful visualizations to help improve key business areas. It is flexible to run on-Cloud or on-Premise using the client's existing technology & infrastructure stack.
Demand Forecasting: This report provides demand forecasting based on various algorithms. The algorithm with the best accuracy gets plotted automatically.
Supplier Performance: Provides an overview of supplier performance over a period of time based on delivering parts on time.
myLOGISTICZ is a Supply Chain Management Analytics & IoT driven technology agnostic solution, which uses powerful visualizations to help improve key business areas. It is flexible to run on-Cloud or on-Premise using the client's existing technology & infrastructure stack.
Demand Forecasting: This report provides demand forecasting based on various algorithms. The algorithm with best accuracy gets plotted automatically.
Supplier Performance: Provides an overview of supplier performance over a period of time based on delivering parts on time.
Damage and Loss Analysis: These reports provide trends for various losses and damages for different warehouses across various loss categories and reasons.
Fraud Analysis: This dashboard helps in finding fraud related activities for different warehouses.
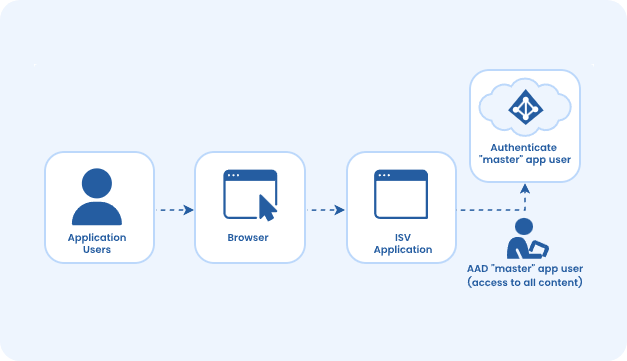
Power B I Embedded
Empower your applications with the power of interactive data visualization. Our Power B I Embedded services allow you to seamlessly integrate stunning Power B I reports and dashboards directly into your web or mobile applications. By embedding Power B I, you can provide your users with real-time insights and data-driven decision-making capabilities, all within the context of your application.

Hire Power B I Consultant
Hire a skilled Power B I consultant to unlock the power of your data. Our experts will transform your raw data into actionable insights through stunning visualizations and in-depth analysis. Contact us today to elevate your business with data-driven decision-making.
Why Choose DEFTeam for Your Power B I Services?
Choose DEFTeam for:

Our team of certified Power B I consultants has years of experience.

We tailor our services to meet your unique business needs.

We help you unlock the power of your data to make informed decisions.

We stay up-to-date with the latest advancements in Power B I.

We are committed to providing excellent customer service and support.
- Expert Consultants
Our team of certified Power B I consultants has years of experience.
- Customized Solutions
We tailor our services to meet your unique business needs.
- Data-Driven Insights
We help you unlock the power of your data to make informed decisions.
- Cutting-Edge Technology
We stay up-to-date with the latest advancements in Power B I.
- Exceptional Customer Service
We are committed to providing excellent customer service and support.
Contact us today to learn more about how our Power B I services can help you achieve your business goals.