
Deprecated Plugin Risk
Grafana's official OPC-UA plugin reached EOL June 2024. Running unsupported software in production creates security and compatibility risk as Grafana versions advance.
Connect your OPC-UA industrial servers directly to Grafana dashboards. Live machine data, historical analysis, enterprise-grade authentication – no custom middleware, no deprecated plugins. Ready for Grafana 10.x through 12.x.
12+
Grafana versions supported
3
Auth methods including certificates
13+
Historical aggregate functions
Grafana's official OPC-UA plugin reached end-of-life in June 2024. It no longer receives updates or bug fixes. Organizations upgrading to Grafana 10.x, 11.x, or 12.x may encounter compatibility issues. DEFTeam's plugin is an actively maintained, drop-in replacement.
Four reasons organizations are replacing legacy OPC-UA Grafana integrations with DEFTeam's actively maintained plugin:
Grafana's official OPC-UA plugin reached EOL June 2024. Running unsupported software in production creates security and compatibility risk as Grafana versions advance.
Most OPC-UA to Grafana integrations require intermediate databases, data pipelines, or third-party products. DEFTeam's plugin connects directly – no extra layers to maintain.
Legacy OPC-UA integrations often lack certificate-based authentication support. Industrial environments need proper encryption and auth – not just anonymous connections.
Machine data locked in SCADA systems or separate industrial tools cannot be combined with IT data in Grafana. Teams end up switching between disconnected tools to get a full picture.
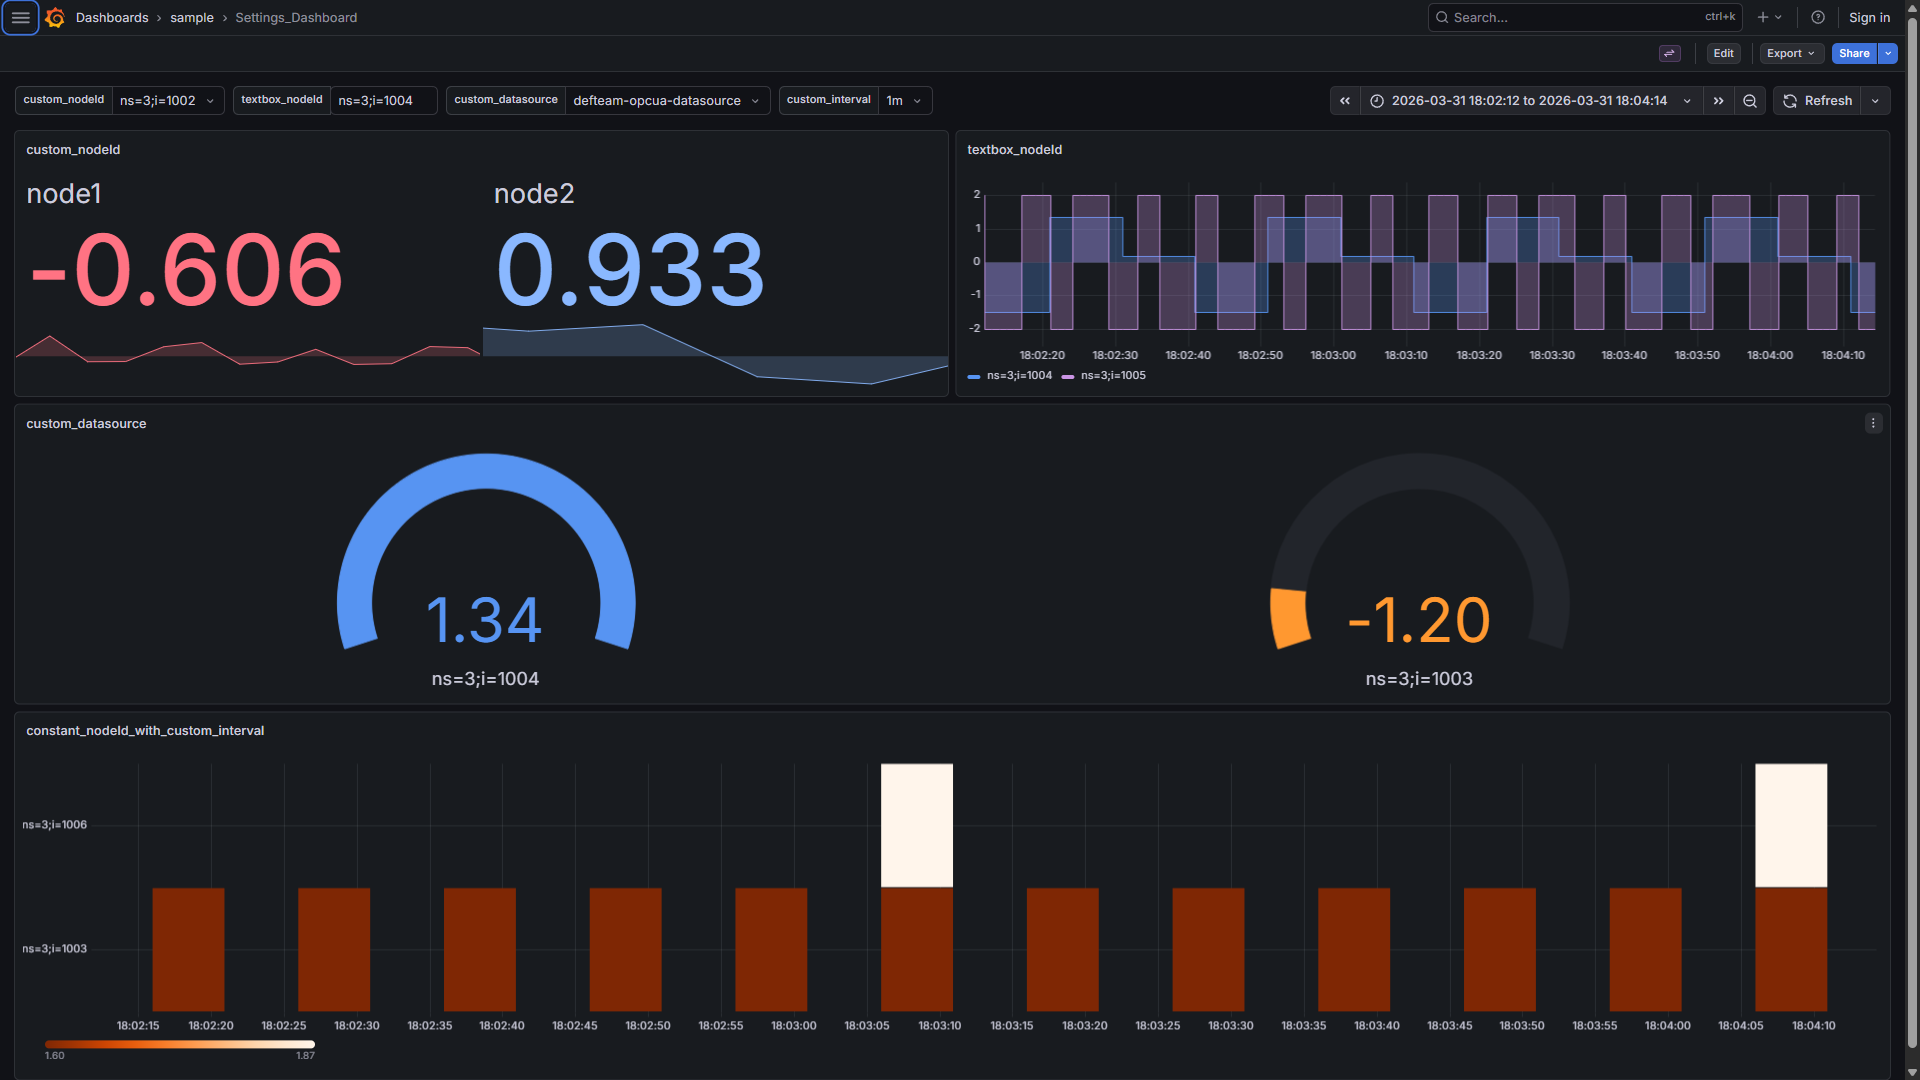
DEFTeam's OPC-UA plugin sits between your Grafana instance and your industrial OPC-UA servers – querying machine data on demand, exactly when a dashboard panel requests it. No intermediate database. No scheduled sync jobs. No data pipeline to maintain.
DEFTeam's plugin installs from the Grafana Plugin Catalog. Setup requires only your server endpoint and authentication method – the visual tag browser handles the rest.
Search "Opcua" in the Grafana Plugin Catalog and install with one click – or use the CLI for automated deployments.
Enter your OPC-UA server endpoint URL, choose your authentication method, and click Save & Test to verify the connection.
Use the visual Tag Browser to explore your OPC-UA address space. Click any variable node to select it – no node IDs needed.
Add live or historical panels, configure alerts on any node, set up dashboard variables, and share with your operations team.
Already using Grafana's deprecated plugin? Migration to DEFTeam's plugin is straightforward – the connection model is similar and our team can assist with the transition to ensure continuity of your existing dashboards and alert rules.
Six capabilities that cover the full range of industrial Grafana monitoring requirements:
Identifies pre-existing conditions based on secondary diagnoses in hospital administrative data. Provides data on how specified comorbidities impact overall hospitalization treatment plans.
Query recorded node data across any time range with 13+ server-side aggregate functions – Average, Min, Max, Count, Delta, Range, Start, End, and more – for fast trend analysis.
Browse the full OPC-UA node hierarchy through a visual tree interface. Search by name, expand folders, and click to select – the node ID populates automatically.
Full integration with Grafana's alert engine. Define thresholds on any OPC-UA node and receive notifications through any Grafana notification channel – no separate alerting system needed.
Use Grafana template variables in node ID and alias fields. One dashboard template serves multiple machines, lines, or facilities – operators switch context with a dropdown.
Mark significant events on time-series charts using historical OPC-UA data. Correlate machine events with operational incidents directly on the dashboard timeline.
Anonymous for internal networks · Username/Password for standard deployments · Certificate-based auth with Basic256Sha256 and AES encryption for production environments requiring maximum security.
Industrial and operations teams that already run OPC-UA infrastructure and want to surface that data in Grafana without custom development.
Industrial organizations generate enormous amounts of OPC-UA data from their equipment. The challenge is getting it to the right people – operations managers, reliability engineers, energy teams – through the dashboards they already use, without building and maintaining a custom integration layer.
Questions IT and operations teams ask before deploying DEFTeam's OPC-UA Grafana plugin.
Whether you need a straightforward plugin installation, a migration from Grafana's deprecated OPC-UA plugin, or a fully managed industrial monitoring setup – DEFTeam's team is ready to help.


 Manufacturing and
production
operations teams needing real-time line visibility
Manufacturing and
production
operations teams needing real-time line visibility

