Visualization Mock-ups of Other Standard Features
-
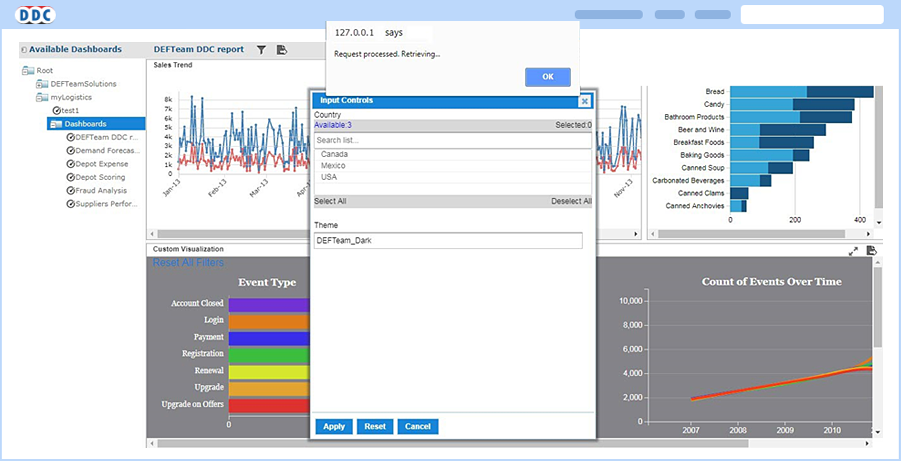
Save & Retrieve
The functionality of Save & Retrieve is implemented in the dashboard to allow users to save the selected input control values with a unique name and then retrieve the past selections by selecting the previously saved selection’s name from the retrieve drop-down list. This enables the user to retrieve the dashboard with saved input controls, and the dashboard will appear with the previously selected list of input options. This also helps to save time when a dashboard has numerous input controls.
-
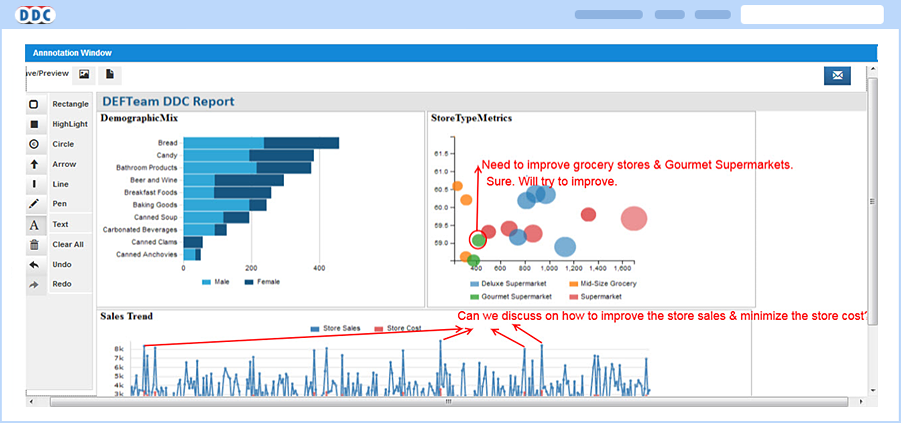
Share Dashboard
DEFTeam also facilitates users sharing the dashboard with desired dashlets (reports), which helps the users to discuss with their peers when and where necessary. Users can achieve this by annotating the captured dashboard, saving it as a PDF/JPEG, and then sharing it via email. Recipients can access this annotated dashboard for further communication.
-
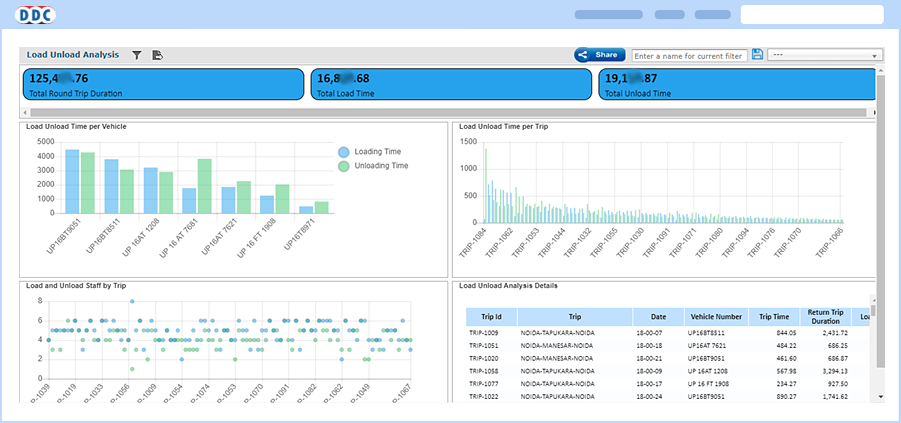
Cross-Filter Feature
The cross-filter feature facilitates a dashlet-to-dashlet interaction in a dashboard. On selection of the vehicle number in the “Load Unload Time per Vehicle” dashlet, it filters data in the remaining dashlets of the dashboard for that selected vehicle number.”
-
Export of Dashboards
The export functionality of dashboards facilitates users saving the dashboard as a PDF/JPEG and sharing the information, thus reducing the human effort and time.
-
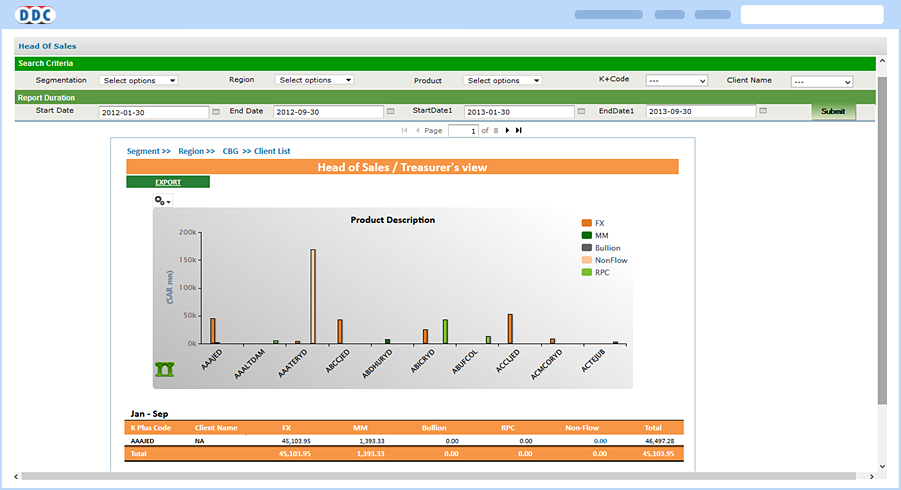
Breadcrumbs
We have developed this by introducing drill-down and drill-through in a dashboard known as Breadcrumbs, in which one can drill-down from segment to client list.
-
Custom Multi-Select IC
To provide flexibility to users to view all the drill-downs and detailed report information on one page rather than multiple browser pages/tabs, DEFTeam has created a component called “Multi-Layered Dashboard.”
-
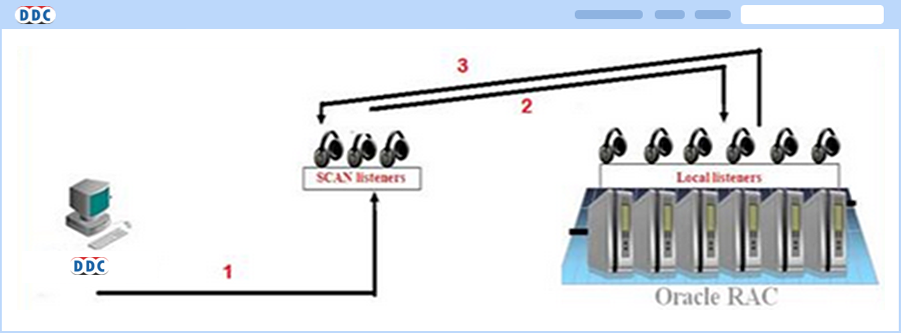
Clustering & Load Balancing
We have introduced this to deploy DDC in a production environment with high-availability, scalable and fault-tolerant service, and provide uninterrupted services to clients without any failover or downtime.
-
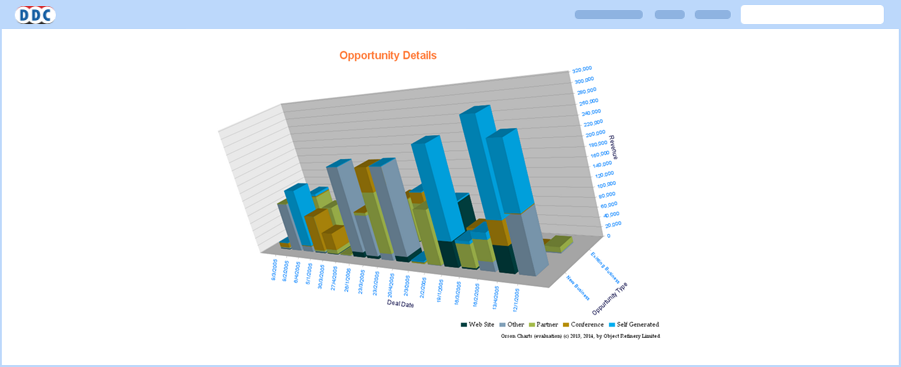
Orson Chart Component
Orson Charts is a 3D chart library for the Java platform that can generate a wide variety of 3D charts for use in client-side (Java FX and Swing) and server-side applications. Powerful and yet easy to use, Orson Charts is the perfect tool to provide intuitive and interactive visualizations to users. We have created a stacked bar 3D Orson chart with X, Y, and Z series integrated with DDC. This plugged-in chart supports all features like exports, scheduling, internationalization, export/import, utility, etc.
For more information on the DEFTeam’s Dashboard Component (DDC) and know how can it efficiently provide an answer to your reporting requirements, contact us today.